Your executive dashboards are lying to you.
You are managing your business via "Watermelon Metrics"—reports that glow green on the outside but bleed red on the inside. Middle management sanitizes data to protect their silos, while traditional PSA software relies on manipulated inputs.
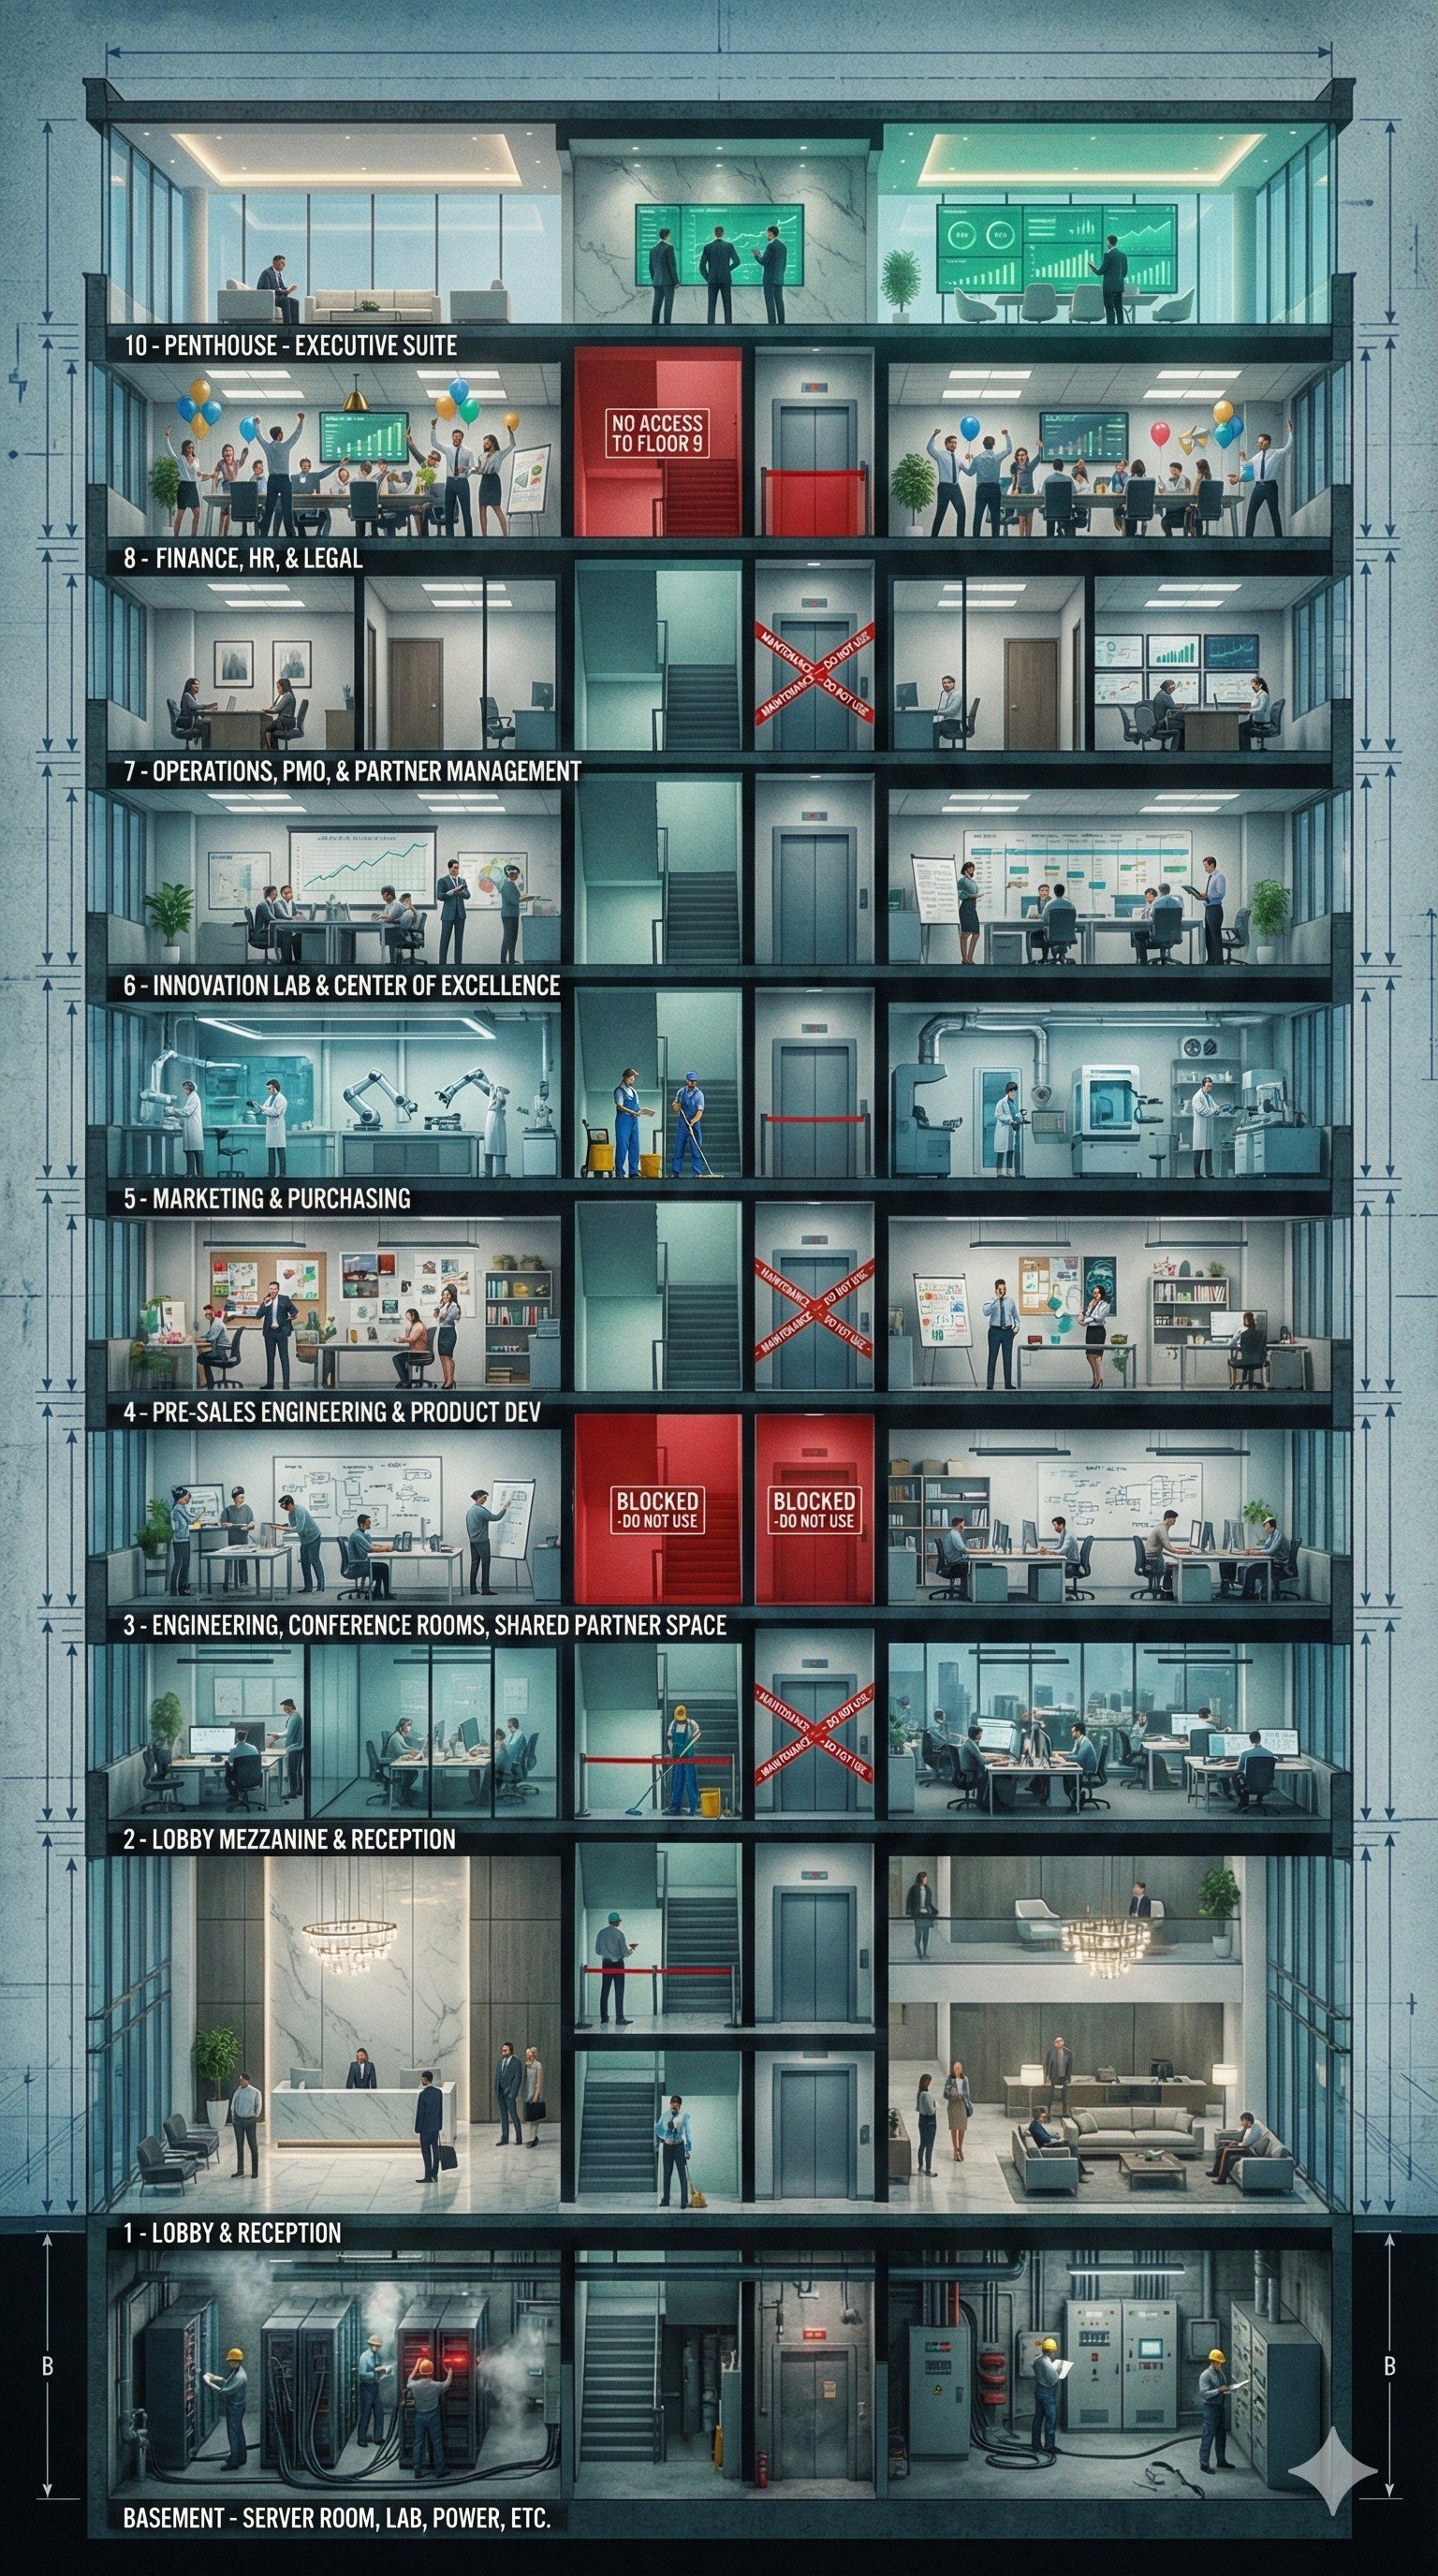
To scale from a bespoke "Art Studio" to an industrialized "Assembly Line," you must bypass the Stairwell Gap and extract the unvarnished truth from the Engine Room. The chart right visualizes where the hidden EBITDA leakage typically occurs when operational friction goes unchecked.
Sources of Hidden Margin Leakage
The Anatomy of Watermelon Metrics
Data reflects typical friction distributions in legacy $50M+ service chassis.
The Compounding Cost of Friction
Target Profit vs. Delivered Reality
Every month of delay drains your EBITDA.
You cannot scale a business when the leadership team is constantly fighting self-imposed friction. Relying on "Hero Culture" to bridge the gap between bad scoping and final delivery creates a widening financial void.
This void is the Inaction Tax™. It is the literal delta between the Sold Contract Value (SCV) promised to the board and the Actual Billed Revenue (ABR) recovered by operations. It expands exponentially as you attempt to scale a broken chassis.
The Physics We Track
Standard dashboards track revenue. InnoVision™ Telemetry tracks the specific operational friction preventing revenue. By deploying our command center, we monitor the structural integrity of your delivery pipeline in real-time.
The 80-Point Operational Friction Index™ (OFI™)
The OFI™ serves as the organizational pulse for underlying friction points. While these 80 markers may not always have a direct, immediately measurable dollar-to-dollar impact on the general ledger, it is undeniably clear that they "cost" the organization heavily—whether in raw EBITDA bleed, delayed execution velocity, burned opportunity capital, and employee pride or loyalty.
The 60-Day Intervention
A deep-dive operational and financial diagnostic utilizing our proprietary methodologies to transition your firm into a predictable Assembly Line.
F.R.A.M.E.™ Assessment
Days 1 - 20 🗓️
Financial & Realization Architecture Maturity Evaluation. A rigid data request targeting raw system exports (PSA, CRM, HRIS) to bypass curated spreadsheets. We identify the Scoping Mirage and map the exact delta between Sold Contract Value and Actual Billed Revenue.
P.U.L.S.E.™ Audit
Days 21 - 40 🗓️
Profitability, Utilization, Leadership, Systems, & Execution. The "Undercover Boss" phase. We deploy anonymous digital surveys to bypass IT surveillance and conduct qualitative extractions to locate Unspoken Roadblocks, Admin Drag, and toxic Hero Culture traps.
T.R.U.T.H.™ Protocol Report
Days 41 - 60 🗓️
Transparent Reporting on Utilization, Teams, and Handoffs. We deliver a visceral, visual executive document containing the Operational Friction Matrix heatmap, Root Cause Diagnoses, and the prioritized 90-day Assembly Line stabilization roadmap.
The Commercial Guarantee
Fixed-Fee Investment
$75,000
Guaranteed Minimum Recovery
$500,000+
If the 60-day diagnostic fails to identify a minimum of $500k in actionable, annualized margin recovery, we issue a prompt, unconditional rebate.
We mathematically guarantee the success of your organizational pivot.